


Account & Billing
Understanding Your Bill
Understand your bill and why your monthly costs may change.
How to Read Your Bill
Your energy bill is made up of several components. These guides are samples of different charges you may see on your bill depending on the type of service you have with us. If you have any questions regarding your bill, please contact our Customer Services department at 319-377-1587.


Common Causes For Bill Fluctuations
Energy bills can fluctuate from month to month for a variety of reasons. Seasonal changes often have the biggest impact, as heating and cooling systems work harder during extreme winter or summer temperatures.
Your energy use may also increase due to lifestyle changes, such as spending more time at home, adding new appliances, or hosting guests. Other factors like electricity demand and even the efficiency of your home’s insulation and equipment can also affect your monthly bill.
Understanding these influences can help you identify ways to manage energy use and keep costs more consistent.
Understanding Weather Degree Days & Energy Use
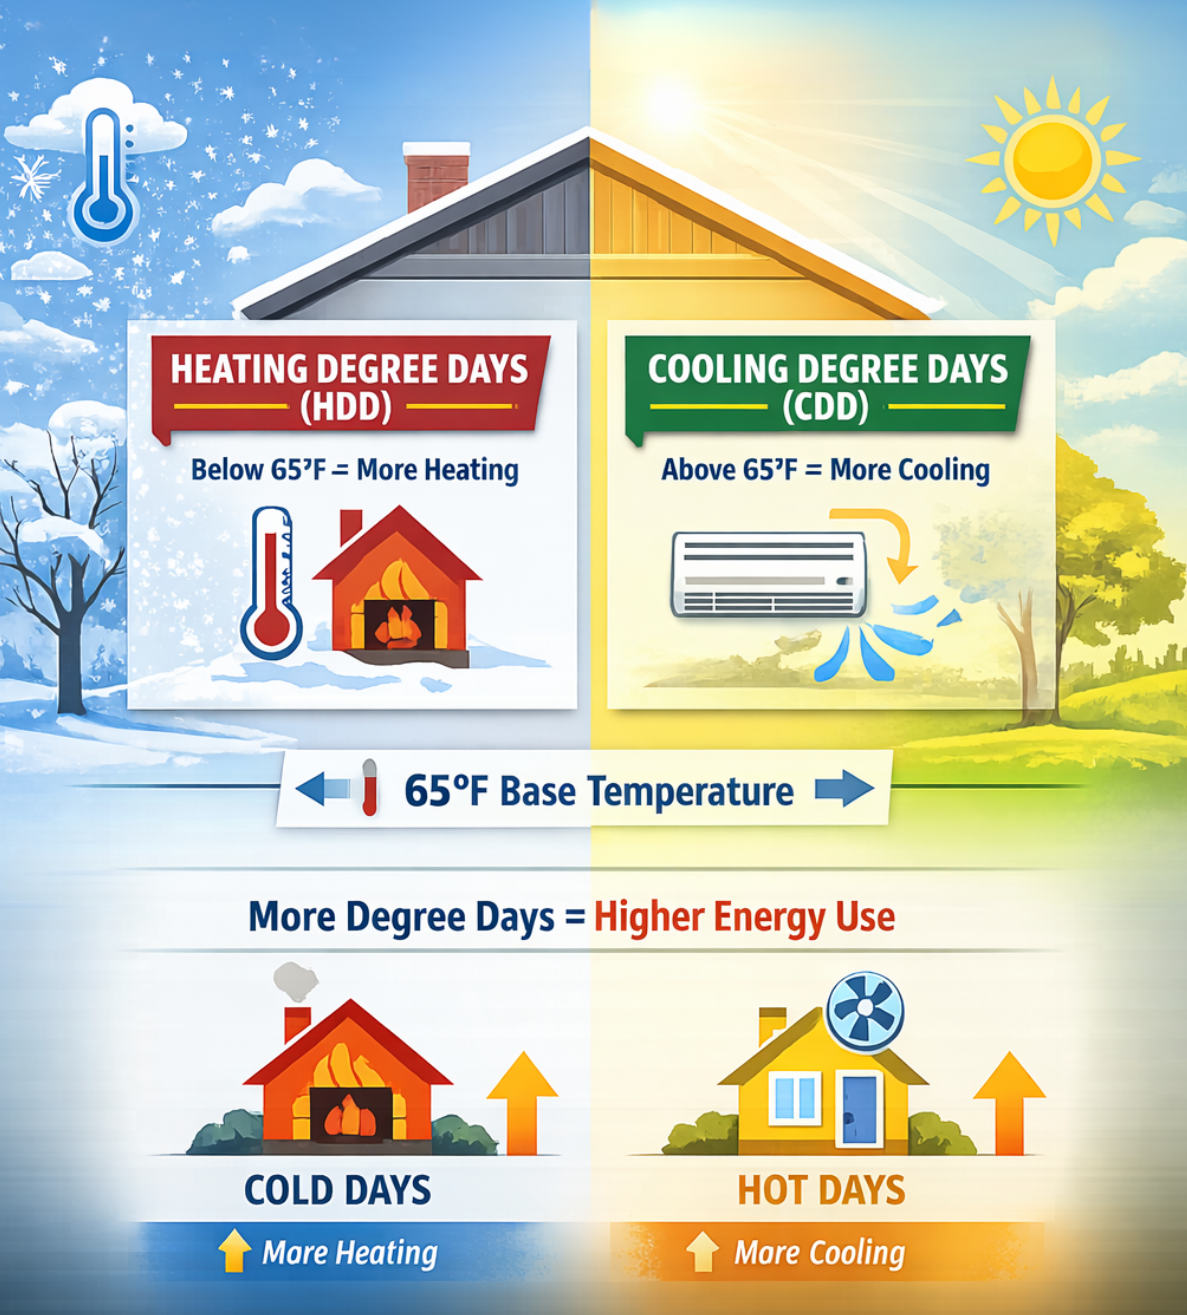
Energy use can rise or fall from month to month even if your routine stays the same—mainly due to outdoor temperature. Utilities use weather degree days to measure how much heating or cooling is needed by comparing the average temperature to 65°F.
When temperatures fall below 65°F, Heating Degree Days (HDD) increase, meaning your heating system runs longer. When temperatures rise above 65°F, Cooling Degree Days (CDD) increase, leading to more air conditioning use.
In both cases, more degree days mean your equipment runs more often, which can lead to higher energy usage—even if your thermostat settings don’t change.
Understanding degree days can help you better interpret seasonal changes in your energy bill and make informed decisions about home energy use.
2025 / 2026 Heating Degree Days
A fair way to compare winter energy bills is to consider how cold it actually was. Heating Degree Days (HDD) provide a simple way to measure how much heating was needed—more degree days typically mean longer heating runtimes and higher energy use.
Based on HDD, December 2025 was about 70% colder than November and 18% colder than December 2024, which helps explain higher usage. In contrast, February 2026 was about 33% milder than January 2026, resulting in lower heating demand.